SPI REPORT
Optimization of TV SPOT Expenditure Distribution by Area
Case
We are sometimes requested to optimize ad expenditure distribution. Optimal distribution by multiple media, optimal placement timing within a year, and optimal spot expenditure by area are exemplary. Here, let’s suppose we have a client aiming for an increase in their product awareness nation wide using the process of optimizing spot expenditure distribution by area under the following conditions:
- Budget: 100 M yen
- Also purchased a national net of TIME
What is optimization?
In this case, optimization is defined as maximizing the awareness rate per unit of ad expenditure in the sum of all areas. In order to achieve this goal, there are two things to consider:
- Optimizing buying effectiveness: How to effectively purchase 1 GRP (Measured by cost/GRP, or in other words per cost)
- Optimizing Ad effectiveness: How to maximize the awareness rate of 1 GRP (Measured by awareness/GRP)
By building a model of efficiency and effectiveness mathematically, we can identify the distribution maximum of awareness per unit in the total area.
Optimization Process
Optimization can be conducted in the following way:
1. Building a model of SPOT expenditure devotion to awareness rate by area by,
a. Building an "Expenditure -> GRP" model
b. Building a "GRP -> awareness" model
c. Building an "Expenditure -> awareness" model
2. Execute optimization using the above built models.
The following are instructions for 1 and 2.
1. Building a model of "SPOT Expenditure to awareness"
Here, we build 2 models, "Expenditure -> awareness" and "Expenditure -> GRP", and "GRP -> awareness", and mix the two at the very end for two reasons:
To reflect the difference of per cost of TIME and SPOT.
To show awareness from ad volume, as it is necessary to measure by GRP, not the expenditure
(a) Building a "Expenditure -> GRP" model
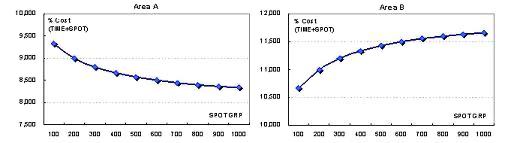
The price of 1 GRP varies with TIME, SPOT, and area. Therefore, the situations below could happen. (In TIME, the concept of per cost is not usually used, but for the comparison to SPOT, TIME per cost is calculated by the results from the past.)
| Area A | Area B |
| SPOT per cost < TIME per cost -> Total per cost decreases as more and more SPOT is devoted | SPOT per cost > TIME per cost -> Total per cost increases as more and more SPOT is devoted |
In this case, it can be concluded that devoting a lot of SPOT into area B is unwise in terms of cost efficiency.
(b) Building a "GRP -> awareness" model
Awareness increased by area varies even with 1 GRP. We can build a single regression analysis from the awareness data and GRP data from the past. Generally, the efficiency of awareness decreases as GRP devotion increases and therefore a non-linear (degression) model is appropriate. (The green line indicates efficiency in each GRP volume)
Next we can establish “the flow of Expenditure to awareness E combining the first two models by area. (TIME must be placed, therefore the model is under the assumption that the SPOT is devoted on top of that.)
2. Executing optimization using the built models.
By using model (c) for all areas, we can then optimize the distribution of the 100 M yen budget to each area. Here, optimization is executed under the condition that the awareness/cost (cost efficiency of awareness) of all areas total is maximized. The following table is the sample result (numbers are artificial):
Written by Kenji Aoyagi, Senior Analyst
Please contact us with questions or for more detailed information.
spiindex@spi-consultants.net
Notice
- This report and its contents are NOT officially guaranteed by SPI, though SPI may deem it worthy according to reliable information, resources & methodology.
- This information is confidential and belongs to the copyright of SPI. Any reference to this information is to include ‘according to SPI’