SPI NEWS
Chronology of SPI Index (Average Cost of TV Spot Market)
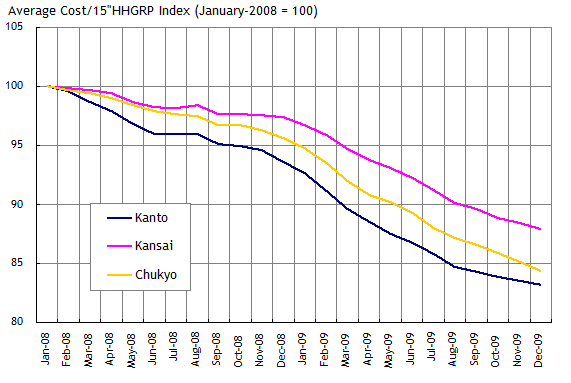
1. Year to year comparison with January 2008 (Average fluctuation over a 12 month period)
Market outlook is seeing continued deflation where it topped 16% for Kanto area, 12% for Kansai area, and 15% for Chukyo area in December 2009. Beginning September 2009, we began to see a slowdown in deflation rate for Kanto area as well as for Kansai area where there were signs of deflation easing. By contrast, deflation pressure is still being felt for Chukyo area.

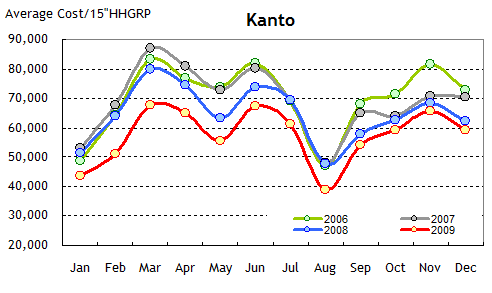
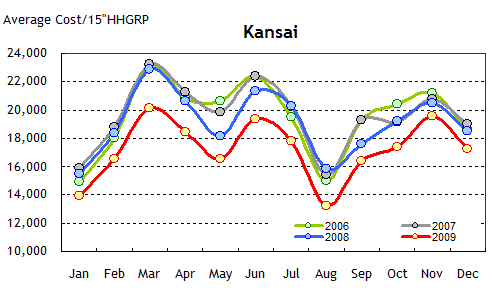
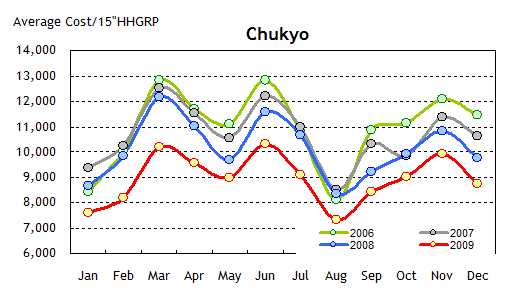
2. Chronological transition by area/month (2006 to most recent months)
Although we did see a 10% price fall continue for Kanto area from December 2008 to September 2009 based on a year to year comparison for the same month, we saw only a 5% fall in the 3 consecutive months for October through December, with continued signs of decline in deflation. Beginning November, deflation rate continued to hover in the range of 5% low in Kansai area as well, showing signs of decline in deflation to a certain degree.
In Chukyo area, by contrast, the rate hovered around a 10% low beginning September 2009, where a year to year comparison for the same month still remains at a 10% range.


Please contact us with questions or for more detailed information.
spiindex@spi-consultants.net
<Notice>
- This report and its contents are NOT officially guaranteed by SPI, though SPI may deem it worthy according to reliable information, resources & methodology.
- This information is confidential and belongs to the copyright of SPI. Any reference to this information is to include ‘according to SPI’

