SPI NEWS
Latest TVSpot purchasing cost trends and its trend forecast by SPI Index until mid 2015
SPI, which encourages “optimizing marketing ROI” and “achieving transparency / accountability”, analyzed TVSpot cost trends in the latest Japanese market.
It has been concluded that:
1, +5~6% inflation in 2014 1st half compared to the previous year
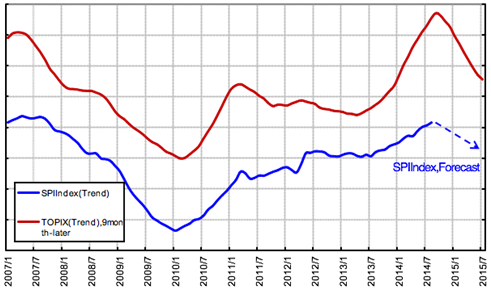
2, The current high inflation ratio is forecast to take a mild downturn and to change to slight deflation by mid 2015
1, +5~6% inflation in 2014 1st half against the previous year
…inflation continued due to the ‘last minute surge in demand’ before the consumption-tax increase in April 2014”, and due to less reaction under continuous economic improvement under “Abe-nomics”.
■The trend of SPI Index = TVSpot cost benchmark (Market average) in Japanese market
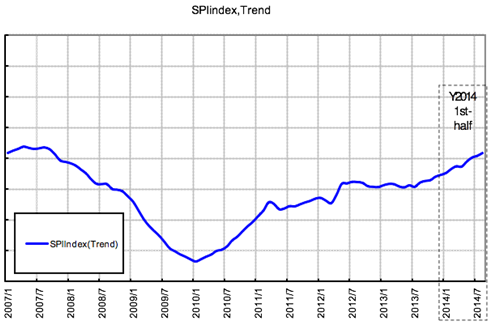
However, there are huge differences in advertisers, by areas and stations.
2, TVSpot purchasing cost trend forecast by SPI Index for the near future
…The current high inflation ratio is forecast to take a mild downturn and change to slight deflation until mid 2015
~~~~~~~~~~~~~~~~~~~~~~~~~~~~~~~~~~~~~~~~~~~~~~~~~~~~~~~~~~~~~
●What is the “SPI Index” for Cost Analysis ?
・Definition of SPI Index
・1st step=SPI Index-basecost
SPI Index-basecost(=All advertisers’ average) = Total TVSpot sales ÷ Total TVSpot GRP
・2nd step= Adjusting “SPIIndex-basecost” for each Spot-buying condition by “SPI’s datapool”
SPI Index-basecost×SPI-adjustment INDEX (due to SPI-datapool from Y1995/over100advertisers & 1,000cases)
↓
SPIIndex(TVSpot cost benchmark for each TVSpot buying condition)
●SPI Index forecast, Methodology
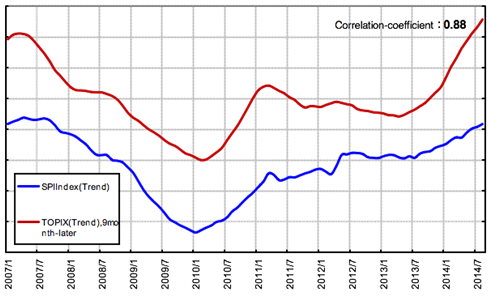
- Indices used for the trend forecast: SPI Index and TOPIX (Tokyo Stock Price Index) SPI found a strong correlation between the SPI Index and the TOPIX.
-
One key finding in SPI’s analysis is the trend of the SPI Index follows that of TOPIX 9 months later.
The analysis indicates that the general business market trend that appears in such indexes as TOPIX could affect advertising spending, and the trend is reflected in the SPI Index that showcases the balance between the demand and the supply in the overall advertising industry. - The SPI Index & TOPIX show the weighted trend that excludes seasonality and noise via SPI’s analytic/mathematical-modeling.
- See the graph of SPI-analysis regarding the correlation between the SPI Index and TOPIX
 ~~~~~~~~~~~~~~~~~~~~~~~~~~~~~~~~~~~~~~~~~~~~~~~~~~~~~~~~~~~~~
●SPI Index Forecast analysis due to the correlation-analysis between TOPIX and SPI Index by SPI
Shiro Kokue
Senior consultant
Please contact us with questions or for more detailed information.
spiindex@spi-consultants.net
Notice
- This report and its contents are NOT officially guaranteed by SPI, though SPI may deem it worthy according to reliable information, resources & methodology.
- This information is confidential and belongs to the copyright of SPI. Any reference to this information is to include ‘according to SPI’